LIFT reports laboratory metallurgical recoveries averaging 79% producing a high-quality spodumene concentrate grading 5.83% Li2O at the Yellowknife Lithium Project
September 23, 2024 – Vancouver, B.C., Li-FT Power Ltd. (“LIFT” or the “Company”) (TSXV: LIFT) (OTCQX: LIFFF) (Frankfurt: WS0) is pleased to report results from the metallurgical sampling program completed in 2023 and 2024 across eight spodumene deposits within the Yellowknife Lithium Project, Northwest Territories, Canada. Metallurgical test work comprised of heavy liquid separation (HLS) testing, dense media separation (DMS) testing, and batch flotation testing was executed by SGS Canada Inc. (“SGS”) in Lakefield, Ontario. Testing was completed on samples from the Big East (BigE), Big West (BigW), Nite, Ki, Echo, Fi Main (FiM), Fi Southwest (FiSW), and Hi pegmatites.
Table 1- Summary of Results
| Sample | Flowsheet | Wt. | Assays (%) | Recovery (%) | |||
| (%) | Li | Li2O | Fe2O3 | Li | Fe2O3 | ||
| BigE | Two-stage DMS + Flotation | 21.1 | 2.7 | 5.79 | 0.76 | 87.4 | 29.3 |
| BigW | 11.1 | 2.67 | 5.75 | 0.76 | 81.4 | 16.0 | |
| Nite | 22.4 | 2.69 | 5.78 | 0.74 | 89.3 | 28.7 | |
| Ki | 18.4 | 2.8 | 6.02 | 0.58 | 84.8 | 22.8 | |
| Echo | 15.7 | 2.87 | 6.17 | 0.85 | 87.1 | 13.8 | |
| FiM | Single-stage DMS + Flotation | 15.8 | 2.6 | 5.59 | 0.49 | 60.8 | 14.7 |
| FiSW | 17.9 | 2.68 | 5.76 | 0.45 | 72.3 | 14.5 | |
| Hi | 16.7 | 2.69 | 5.77 | 0.46 | 70.1 | 14.6 | |
| 5.83 | 79.1 | ||||||
| Average Spodumene Concentrate Grade (Li2O %) | 5.83 | ||||||
| Average Global Lithium Recovery (%) | 79.1 | ||||||
Francis MacDonald, CEO of LIFT comments, “We are very pleased to report that the comprehensive metallurgical testing studies in preparation for our upcoming Preliminary Economic Assessment (PEA) yielded positive results. Studies notably included pilot-scale DMS testing that indicated that this lower-cost separation method is suitable for the spodumene-enriched pegmatite dikes that are targeted for the more accessible early mining sites that we envision could comprise lithium production in the district for a generation or more. As such the results of these important studies underpin the high value potential for our Yellowknife lithium project.
Details of metallurgical program
Lithium chemical analysis of the metallurgical samples was performed by sodium peroxide fusion digestion followed by inductively coupled plasma optical spectroscopy (ICP-OES). Whole rock analysis (WRA) was performed by borate fusion and X-ray Fluorescence (XRF). Elemental compositions of the pegmatite samples are presented in Table 2. Pegmatite sample grades ranged from 0.86% to 1.46% Li2O and from 0.24% to 0.48% Fe2O3.
Table 2: Chemical analysis of the metallurgical samples
| Component | Composition (%) | |||||||
| BigE | BigW | Nite | FiM | FiSW | HI | KI | Echo | |
Li Li2O Fe2O3 SiO2 Al2O3 MgO CaO Na2O K2O MnO |
0.63 1.35 0.44 73.6 16.2 0.16 0.24 4.06 2.56 0.06 |
0.40 0.86 0.34 73.8 15.7 0.07 0.28 4.52 2.88 0.05 |
0.67 1.44 0.48 73.9 16.0 0.06 0.24 3.77 2.55 0.10 |
0.68 1.46 0.27 73.0 16.4 0.07 0.30 3.93 2.57 0.02 |
0.62 1.33 0.29 74.0 16.1 0.07 0.26 3.97 2.76 0.03 |
0.63 1.35 0.39 73.4 16.2 0.08 0.30 3.83 2.63 0.03 |
0.60 1.29 0.24 73.5 16.1 0.08 0.28 3.92 2.79 0.02 |
0.56 1.20 0.33 73.1 16.4 0.10 0.24 4.53 2.53 0.04 |
The mineralogical compositions of the metallurgical samples were determined using the semi-quantitative XRD and are shown in Table 2 . Spodumene concentrations in the pegmatites ranged from 11.0% to 18.3% and are in line with lithium concentrations (i.e., spodumene is the dominant lithium-bearing mineral identified). Minor amounts (1%) of triphylite (LiFe(PO4)) was detected in the FiM sample. Muscovite concentrations in the pegmatite samples ranged from 4.5% to 7.8%. Minor quantities (<1%) of iron-bearing minerals (e.g., chlorite, chlinochlore) were detected.
Table 3 – Metallurgical sample mineralogy from semi-quantitative XRD. Only minor amounts of non-spodumene lithium-bearing minerals were found in samples with ~99% of lithia being hosted in spodumene.
| Mineral | Composition (%) | |||||||
| BigE | BigW | Nite | FiM | FiSW | Hi | Ki | Echo | |
| Spodumene | 17.9 | 11 | 18.3 | 17.8 | 17.3 | 17.2 | 13.0 | 14.6 |
| Albite | 36.5 | 38.9 | 34.2 | 33.3 | 34.6 | 34.7 | 34.0 | 40.4 |
| Quartz | 26.5 | 28.3 | 28.7 | 28.8 | 28.2 | 28.9 | 27.3 | 26.5 |
| Microcline | 12.8 | 15.7 | 13.1 | 10.3 | 13.7 | 12.3 | 13.0 | 11.6 |
| Muscovite | 4.9 | 4.5 | 4.1 | 7.8 | 5.2 | 5.4 | 6.0 | 5.4 |
| Fluorapatite | 0.6 | 0.7 | 1.1 | 0.5 | 0.5 | 0.8 | 0.9 | 0.8 |
| Triphylite | - | - | - | 1.0 | - | - | - | - |
| Beryl | 0.2 | 0.7 | 0.3 | 0.2 | 0.2 | 0.2 | 0.3 | 0.2 |
| Magnetite | 0.2 | 0.3 | 0.2 | 0.1 | 0.3 | 0.3 | 0.2 | 0.3 |
| Chlorite | 0.3 | - | - | 0.3 | - | 0.3 | - | - |
| Chlionochlore | - | - | - | - | - | - | 0.2 | - |
| Total | 100 | 100 | 100 | 100 | 100 | 100 | 100 | 100 |
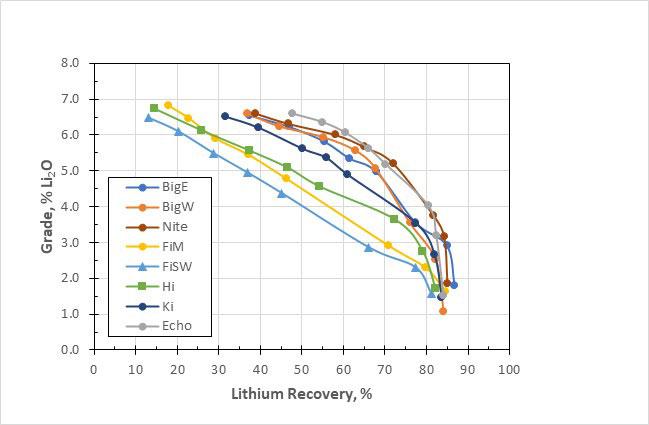
Heavy Liquid Separation (HLS) tests were performed on eight metallurgical samples. The samples were sourced from saw-cut channel samples on the surface of the various dykes. The samples were stage-crushed to a top crush size of 6.35 mm. The -6.35 mm +0.85 mm fraction was submitted for HLS testing which achieved global lithium recoveries ranging from 29% to 68% (interpolated to 5.5% Li2O concentrate grade). HLS test results are presented in Figure 1.
Figure 1 – HLS global lithium grade-recovery curves
Pilot-scale DMS was operated on each metallurgical sample. Two-stage DMS was undertaken on five of the samples (i.e., BigE, BigW, Nite, Ki, and Echo) and a single-stage DMS was operated on three of the samples (i.e., FIM, FiSW, and Hi).
For the two-stage DMS tests, global lithium recovery ranged from 49.9% to 60.4% with spodumene concentrate grade ranging from 5.81% to 6.41% Li2O with relatively low iron content ranging from 0.62% to 0.88% Fe2O3. For single-stage DMS operation (pre-concentrate production), global lithium recovery to the fines and sinks stream ranged from 93.0% to 95.2%. Pre-concentrate grades ranged from 1.90% to 2.02% Li2O and 0.53% to 0.55% Fe2O3.
Table 4 - Pilot-scale DMS test work results
| DMS | Sample | DMS Products | Wt. | Assays (%) | Recovery (%) | |||
| (%) | Li | Li2O | Fe2O3 | Li | Fe2O3 | |||
| Two-Stage DMS | BigE | Concentrate |
14.9 | 2.7 | 5.81 | 0.71 | 59.9 | 17.8 |
| BigW | 7.8 | 2.71 | 5.83 | 0.75 | 57.4 | 11.9 | ||
| Nite | 15.4 | 2.71 | 5.83 | 0.77 | 60.4 | 27.4 | ||
| Ki | 10.8 | 2.86 | 6.15 | 0.62 | 49.9 | 18.1 | ||
| Echo | 10.5 | 2.98 | 6.41 | 0.88 | 58.4 | 19.5 | ||
| Single-Stage DMS | FiM | Pre-Concentrate (Fines + Stage 1 Sinks) |
72 | 0.88 | 1.9 | 0.53 | 93 | 80.9 |
| FiSW | 68.1 | 0.9 | 1.94 | 0.54 | 95.1 | 76.7 | ||
| Hi | 66.8 | 0.94 | 2.02 | 0.55 | 95.2 | 77.9 | ||
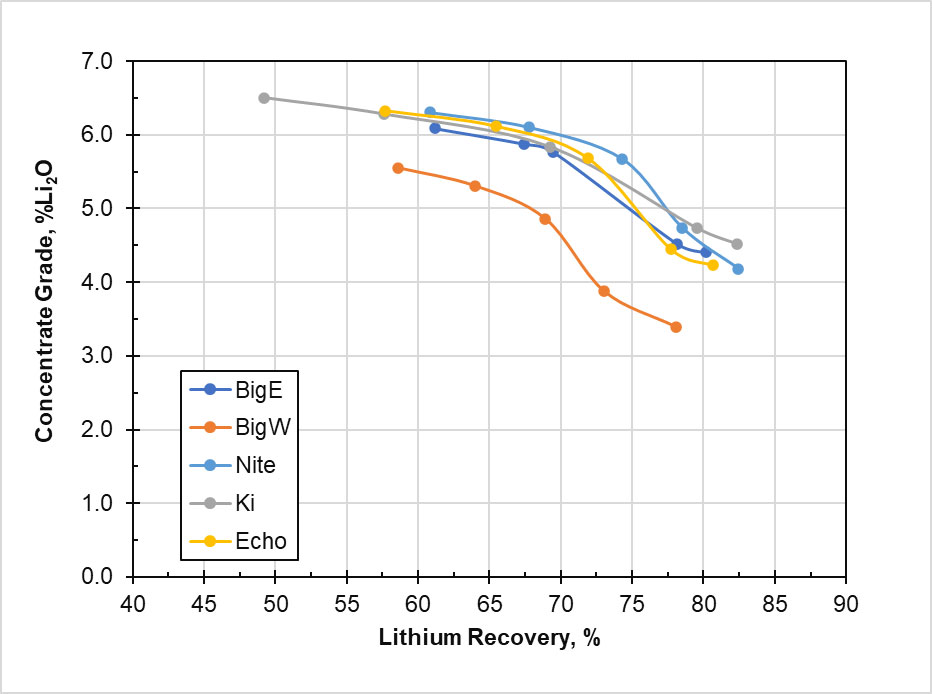
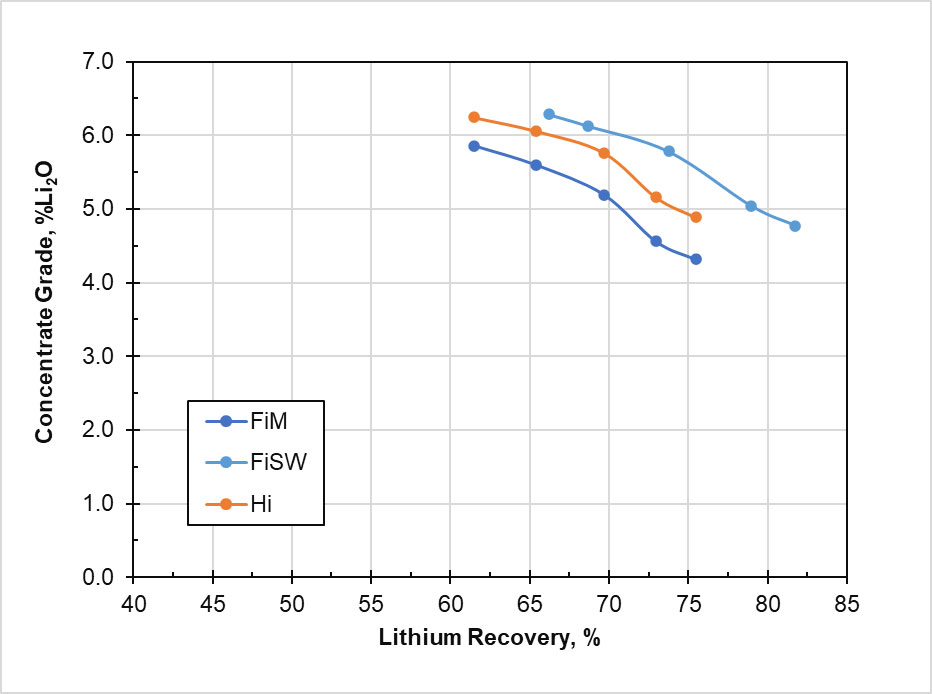
Three sets of flotation tests were performed on head samples or products from DMS operation (fines and DMS Stage 1 sinks or fines and Stage 2 DMS floats). For the flotation tests undertaken on the head samples, all samples produced roughly 5.5% Li2O spodumene concentrate with lithium recovery ranging from roughly 69% to 72%. For flotation tests undertaken on the fines and stage 2 DMS floats, 5.5% Li2O spodumene concentrate was produced with lithium recovery ranging from 56% to 75% (Figure 2). For flotation tests undertaken on the fines and stage 1 DMS sinks, 5.5% Li2O concentrate was produced with lithium recovery ranging from roughly 66% to 77% (Figure 3).
Figure 2 - Flotation test results on DMS fines and stage 2 DMS floats
Figure 3 - Flotation test results on fines and DMS Stage 1 sinks
Overall laboratory lithium recoveries were calculated based on the DMS and batch flotation test results. Results for the two-stage DMS and flotation flowsheet produced combined concentrates ranging in grade from 5.75% to 6.17% Li2O and lithium recoveries ranging from 81% to 87%. Tests undertaken with a single-stage DMS pre-concentration step followed by flotation produced concentrates ranging in grade from 5.59% to 5.77% Li2O with laboratory-scale lithium recoveries ranging from 61% to 72%.
Qualified Person
The disclosure in this news release of scientific and technical information regarding LIFT’s mineral properties has been reviewed and approved by Jarrett Quinn, Ph.D., P.Eng, Process Director, Synectiq Inc.., and a Qualified Person as defined by National Instrument 43-101 Standards of Disclosure for Mineral Projects (NI 43-101) and member in good standing of the Ordre des Ingénieurs du Québec (OIQ) (Registration number: 5018119).
About LIFT
LIFT is a mineral exploration company engaged in the acquisition, exploration, and development of lithium pegmatite projects located in Canada. The Company’s flagship project is the Yellowknife Lithium Project located in Northwest Territories, Canada. LIFT also holds three early-stage exploration properties in Quebec, Canada with excellent potential for the discovery of buried lithium pegmatites, as well as the Cali Project in Northwest Territories within the Little Nahanni Pegmatite Group.
For further information, please contact:
Francis MacDonald
Chief Executive Officer
Tel: + 1.604.609.6185
Email: [email protected]
Website: www.li-ft.com
Daniel Gordon
Investor Relations
Tel: +1.604.609.6185
Email: [email protected]
Cautionary Statement Regarding Forward-Looking Information
Certain statements included in this press release constitute forward-looking information or statements (collectively, “forward-looking statements”), including those identified by the expressions “anticipate”, “believe”, “plan”, “estimate”, “expect”, “intend”, “may”, “should” and similar expressions to the extent they relate to the Company or its management. The forward-looking statements are not historical facts but reflect current expectations regarding future results or events. This press release contains forward looking statements. These forward-looking statements and information reflect management's current beliefs and are based on assumptions made by and information currently available to the company with respect to the matter described in this new release.
Forward-looking statements involve risks and uncertainties, which are based on current expectations as of the date of this release and subject to known and unknown risks and uncertainties that could cause actual results to differ materially from those expressed or implied by such statements. Additional information about these assumptions and risks and uncertainties is contained under "Risk Factors and Uncertainties" in the Company's latest annual information form filed on March 27, 2024, which is available under the Company's SEDAR+ profile at www.sedarplus.ca, and in other filings that the Company has made and may make with applicable securities authorities in the future. Forward-looking statements contained herein are made only as to the date of this press release and we undertake no obligation to update or revise any forward-looking statements whether as a result of new information, future events or otherwise, except as required by law. We caution investors not to place considerable reliance on the forward-looking statements contained in this press release.
Neither the TSX Venture Exchange nor its Regulation Services Provider (as that term is defined in the policies of the TSX Venture Exchange) accepts responsibility for the adequacy or accuracy of this news release.


